
 The future of energy will be driven by a combination of price and availability, as it always has. But in today’s uncertain world one thing is very sure, and that is that this combination is already in rapid transformation, meaning that we are now looking at a very different energy future indeed. In this four part series, we are looking out into the near term future of a battle already well underway, the unfolding market contest between non-renewables and renewables. In Part II of this series we are looking for price trends in the economically significant renewables, today, are firewood, hydroelectricity (large or small scale), storage batteries, wind power and solar power. Firewood is not a commercial fuel except in some of the poorest and remote countries. The two most dynamic renewable technologies for electricity generation today are wind turbines (either on-shore or offshore) and solar power. The number of installations of wind turbines and solar panels is large enough so that both can be treated analytically as aggregates, which we shall now look at here.
The future price of renewables
– Robert U. Ayres. Washington DC. 4 November 2014
Introduction.
The most important source of useful energy (exergy) in the world today is petroleum. Oil is used primarily for liquid fuels (and secondarily for chemicals). Liquid fuels are needed for all kinds of internal combustion engines (spark-ignition, diesel or gas turbines) for transportation, agriculture, mining and off-road construction (and military) applications. Almost all of the so-called “renewables” are used for producing electric power. The global economy is gradually electrifying, even transportation, although the electrification of vehicles is still several decades in the future. Most of the electric power generated in the world is currently used for stationary applications, ranging from lighting to cooking, refrigeration and air-conditioning, metallurgy (electric furnaces), electrolysis, industrial motors , data processing and communications.
Because they serve somewhat different markets, it is difficult to compare the price of “renewables” as a group with the price of oil. The latter is a global commodity. But practically none of it is used to produce electric power. (There was a time in the 1960s and ‘70s when petroleum was cheap and residual oil was used for electric power generation, but that time is past.) On the other hand, there is no liquid “renewable” fuel , except ethanol from corn and biodiesel from rapeseed or sunflower oil. Ethanol from corn is heavily subsidized in the US, but only as a boon to the farmers; in Brazil it is derived from sugar cane. (That scheme was initiated as an energy-security project before PetroBras found offshore petroleum deposits. It is economically viable today only because the investments have already been made). Bio-fuel from oil-seeds is produced, mainly in Europe, but in quantities too small to allow meaningful long-term projections. In both cases, there is an obvious conflict with food production. Oil from algae is an interesting future possibility, but is still in the pre-production stage. No-one knows how it will scale. There are some positive indicators, but nothing justifying a serious future price projection at this time.
So, the problem here is very much like comparing apples and oranges. The single application where electricity and petroleum compete is in cars. We discuss cars later.
The economically significant renewables, today, are firewood, hydroelectricity (large or small scale), storage batteries and ran on wind power and solar power. Firewood is not a commercial fuel except in some of the poorest and remote countries, where it is converted inefficiently into charcoal for local markets. The two most dynamic renewable technologies for electricity generation today are wind turbines (either on-shore or offshore) and solar power. The latter comes in two very different forms: solar concentrators (mirror-based systems) and photo-voltaic panels for rooftops, walls or separate sun-following units arranged in “farms”. The number of installations of wind turbines and solar panels is large enough so that both can be treated analytically as aggregates.
As for tidal and geothermal power, both are currently too small in scale, and too dependent on particular geographic characteristics, to provide any basis for meaningful future extrapolations. One can only say that both technologies will improve with experience. Hence applications will increase on number and size in coming years, giving rise to economies of scale. It is too early to speculate as to whether either or both will capture a significant share of the power market in the next two decades.
According to the United Nations Environment program, from 2004 through 2013, worldwide expenditures on renewables of all kinds, including R&D but not including large hydroelectric facilities, amounted to $1.66 trillion [http://fs-unep-centre.org/publications/gtr-2014]. Of that, wind and solar probably accounted for $1.3 trillion. During those years, prices for solar technology, in particular, were declining rapidly. But wind and solar power are intermittent. The so-called capacity factors for both technologies are rather low: for wind 18% in Germany, 26% in the UK, 30% in Denmark and probably 40% or more in future off-shore wind farms. The capacity factor for solar power ranges from 10 % in Germany to 20% in Arizona.: By comparison, US coal plants average 63.8 %, gas plants average 42.2% (before shale gas came along ) while nuclear plants operate 90% of the time. Today nuclear power costs about $8000/kw but the plants would presumably last for 50 years, while wind turbines and PV facilities are expected to last 20 years and cost about $2000/kw, and $4000/kw respectively. (But the latter number is dropping fast).
On this basis, one nuclear power advocate argues that (for the UK wind costs 3 times as much and solar costs 10 times as much as nuclear power.[1] Based on those numbers, and disregarding some other numbers (such as the unknown costs of disposal of spent nuclear fuel rods, and risks of nuclear conflict – or its prevention – due to the proliferation of nuclear technology) he is right. However, the main problem with that calculation is that it is static. The purpose of the following discussion is to assess future costs, not current ones.
Scale economies and experience curves
Here we need to digress briefly to explain how future cost/price trends can be forecast with reasonable accuracy. There are essentially three mechanisms involved. One is slow incremental technological improvements. The second is economies of scale and the third is “learning by doing”{Arrow, 1962 #192}.The first mechanism may be central for a technology such as PV, where the materials themselves are still being modified thanks active laboratory R&D. It isn’t very important for mature technologies adapted from other uses. An example of the latter would be turbogenerator design (except for the composition of the permanent magnets) and propeller design, borrowed from aircraft.
Economies of scale come in two varieties. One simply mean that bigger is cheaper, not in absolute terms, but per ton or (for a turbo generator) per kilowatt of output, bigger blast furnaces are more efficient than small ones, because they allow higher temperatures and less heat loss, due to the surface-volume relationship. Something of the sort also applies to power generators, although for a different reason. (The problem with small size is heat dissipation.) The other economy of scale refers to the manufacturing process. In that case, the economies come from the fact that there are fixed costs as well as variable costs. As the number of units increases, some fixed overheads can be spread over more units. (This is a prime motivation for mergers and acquisitions between firms in the same business).
Then, there is a third phenomenon, called “learning by doing”, which simply reflects the fact that the employees, and the organization, get better the more practice they have had. The learning curve, combined with the economy-of scale in terms of output, yields a composite relationship called the “experience curve.” It turns out that in many cases, perhaps most, the cost of production falls as a simple declining exponential function of experience X, measured as total cumulative production to date. Here a little math is helpful. Price at time t is described by an equation of the form
Po = Pt X-E
where Po is the price of the first unit, at time zero, and Pt is the price at time t. The experience is X which is the cumulative output and E is the experience parameter. The “curve” is usually a straight line when X is plotted on a logarithmic scale, as will be seen below.
The standard presentation of experience curves is in terms of the so-called Progress Ratio (PR), which is the ratio of price at 2X with the price at X, which turns out to be 2-E. In other words, it is the rate the rice declines every time the cumulative experience is doubled. The bigger the parameter E, the faster the price declines. As an example, if E = 0.29 the PR is 2-0.29 = 0.82. Another way of saying the same thing is that the price declined 18 percent for each doubling of cumulative output during that period. Of course, doubling can occur much more frequently in the early period after a start-up. Later on, doubling takes longer, which is why the rate of price decrease per year slows down. But the process can continue for a very long time, as in the case of ”Moore’s Law”, which was firs formulate in 1970 but seems to be valid yet.
So much for mathematics. But it is important to note that the experience curve is sufficiently regular, and widely applicable , to be used for forecasting in the short to medium term. Of course there are caveats to that remark. In particular, technological changes – other than small incremental improvements — can change the shape of the experience curve. The experience curve appears to be a universal phenomenon. The phenomenon was understood qualitatively long ago, but it became a useful quantitative management tool in the 1970s, when Bruce Henderson, at Boston Consulting Group (BCG) used it to explain why the first company to start manufacturing an item (such as a transistor, or a radio) had an automatic price advantage, due to its greater experience {Henderson, 1989 #7681}. This turned out to be a powerful strategic tool for business (or at least for business consultants). The experience curve is based on historical performance, of course, but it is generally applicable to forecasting the future.
Wind power
Wind turbines are as different from the old-fashioned wind-mills formerly seen in Holland (or in the Spanish Mancha of Don Quixote).They differ as steam turbines differ from water-wheels, although the rotating blades are large versions of aircraft propellors. But rather than producing mechanical power for grinding grain (for instance) the wind turbines produce electrical power from moving air in the same way that hydro-electric power plants utilize flowing water. Generator design has not changed much in the past century except for miniaturization due to the use of more powerful permanent magnets, Remember, electricity is generated as a conductor (the rotor) moves through a magnetic field (the stator), or conversely the magnets may be in the rotor. Most large conventional generators use electro-magnets with iron cores. However the technological breakthrough that has made wind turbines competitive is the drastic reduction in power-to weight of the turbo-generator. That breakthrough, in turn, was based on the discovery of rare-earth alloys (mainly using samarium or neodymium) with extraordinary magnetic properties,. These enable the construction of very lightweight motors and generators with permanent magnet cores. It is the (relatively) light weight that makes wind-turbines mounted on towers feasible.
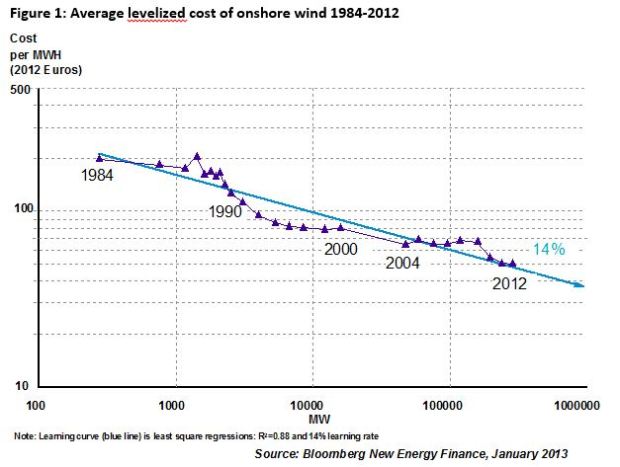
Wind power became commercial in Denmark starting around 1982. From 1982 to 1997 the “progress ratio” (defined above) was 96% {Wene, 2000 #5541} p.13. But progress speeded up as the technology spread to other countries and scale economies kicked in. The progress ratio for both average and “best performance” wind power from 1980 through 1995 was 82 % (ibid) p.21. The history of wind power is not a particularly good example of the experience curve, however. There was rapid progress from 1986 to 1993 or so, then very slow (but steady) cost reduction until 2008, followed by a sharp (80%) decline in prices from 2008 through 2012 (Michael Liebrich, Bloomberg, new Energy Finance, January 19, 2013 (Figure 10) .The recent acceleration of cost decreases may be attributable to the fact that wind power is beginning to move off-shore, where larger turbines are acceptable.
And what of the future of wind power? A survey of forecasts to 2030 from the literature, by the US Department of Energy (?) indicates a wide range of expectations. But even the most pessimistic expected the levelized cost of wind power to decrease by 15% over that period, while the most optimistic expects a decrease of 35%. The median forecast price decline is 25% (Figure 11).

Solar Power
Solar technology is important because some would argue that, along with wind power, it must be the long-term solution to the global energy problem. The potential supply is virtually unlimited. Every 14.5 seconds the sun sends as much energy to the Earth as humanity uses in a day. It takes 88 minutes of sunlight to provide as much energy as we use in a year, most of which (currently) is from fossil fuels. It is obvious that we need to tap into this energy (exergy) more efficiently, which is what solar power, and PV is all about.
In fact, as mentioned briefly above, the progress ratio (PR) for photo-voltaic panels PV from 1976 through 1992 was 82% {Wene, 2000 #5541} p.11.The rate of change has varied considerably since then. From about 1985 through 2003 the price of silicon PV modules declined rapidly, though the rate of decrease has slowed down since then. In 1992 the price was about $17 per watt, in 2009 dollars. By 2009 it was down to $3 per watt, and the following year it dropped a further 30% to about $2/watt. Prices fell a further 20% in 2012.
One reason for that price decline is the shift from silicon (crystal or amorphous) PV cells, which were the only type produced until the ‘90’s, to the thin film panels that are increasingly important today. Thin film PV is a different technology, using different (and scarcer) materials including indium and tellurium and manufactured in a different way. So a different experience curve would be appropriate. We will come back to this later. Interestingly, the thin-film module price was essentially equal to the silicon module price in 2012. Since 2000 the price of thin films has been declining at about 7% per year. It seems likely to continue along that trajectory. Costs decline because of R&D, deployment expertise (learning-by-doing) and economies of scale in component production. By 2030 the price of electricity from PV cells should be down to about $0.50 per watt. At that level, PV electric power will cost less than half of the present cost from the old, fully amortized coal-fired power plants that still dominate the supply-side. In fact the break-even point seems likely to be around 2020, possibly even sooner, although it depends on location, storage, and other factors. The capital cost of a solar PV “farm” in the US (2015) is already comparable to that of a conventional pulverized coal power plant, and the fuel cost is zero, although maintenance cost is not.
The major problem for solar power is the fact that solar power is intermittent. The sun does not shine at night, and it is not always bright during the day. So the capacity factor for solar power ranges from 14% to 26% whereas the coal powered plant is assumed to be operating 80% of the time. To make up for this difference, it seems that the capital cost of solar power will have to decline considerably more to reach “grid parity”.
Another disadvantage of the intermittent technologies (both wind and solar) is that output does not correlate with demand. Periods of high output often occur when demand is low (and conversely) which means that there can be a surplus of electric power from the intermittent source at one moment and a shortage the next. (In fact these changes can occur in a very short time, even a few seconds. This is called the “ramping” problem in the utility business. It the reason that gas turbines are kept on line in many locations for load adjustment, simply because they can be turned on and off quickly. One solution is grid interconnection: periods of high wind or no wind are likely to be fairly localized. But grid interconnections over long distances are very costly. The other solution is low cost energy storage. For small local PV rooftop installations, the likely solution to the capacity factor problem is lithium batteries. We discuss this topic later.
However, for large installations of concentrated solar power (parabolic troughs or solar towers), the likely solution is thermal storage via molten salts. The first large scale SCP plant in the US to utilize molten salt storage is the Crescent Dunes project in Nevada, due to be completed in 2014. It will be rated at 110 megawatts, with 6 hours of thermal storage giving it a capacity factor of between 40% and 50%, and allowing it to provide power for the peak evening air-conditioning load in nearby cities such as Las Vegas.
There is an on-going dispute as to the relative merits of decentralized (e.g. rooftop) PV and CSP. Enthusiasts note that when the first of nine parabolic trough CSP plants were built in the Mojave Desert the cost was $0.45/kwh (2005 dollars) whereas costs of electricity from the ninth plant were down to $0.09-$0.12/kwh. Further cost reductions ar certainly expected, thanks to reductions in capital costs (18-22 percent), efficiency gains (10-15 percent) and economies of scale in the manufacturing of components such as the mirrors (21-33 percent). Overall cost reductions of 40% to 55% are expected {Gielen, 2012 #7736}. Enthusiasts at the enter for American Progress (CAP) and WorldWatch Institute, argue that CSP technology could provide 7% of global electricity demand by 2025 and 25% by 2050 (based on a “white paper”.
Other experts argue that the future belongs to decentralized PV with local battery storage, where the rate of cost/price reduction is even faster than for CSP or wind, and where economies of scale appear to be significantly greater. The comparison between decentralized PV and traditional coal-fired generating technology is not nearly as unfavorable as the skeptics argue, for two reasons. First, the conventional pulverized coal technology is no longer acceptable because of its pollution. New EPA regulations will force those old plants to install quite a lot of expensive pollution-control technology within a year or shut down. If coal is to be used it will have to be with gasification, removal of sulfur dioxide and nitrogen oxides, and capture and sequestration of carbon dioxide. That will cost a lot more (and it will utilize 25% to 30% of the power output. And second, storage technologies are available that can increase the effective capacity factor substantially, at modest extra capital cost. For example, six hours of storage capacity (enough to take care of the peak air-conditioning demand on hot days) can increase the capacity factor from 20-25 percent to 40-55 percent.
Energy (exergy) storage
So called “pumped storage” for large centralized power plants is a commonplace, especially in areas dependent on hydroelectric power, where river flows can be very low during dry months or droughts. This technology may, or may not, be appropriate for the case of short-term variations in wind, because existing pumped storage facilities are not designed for quick flow reversal. Moreover, pumped storage generally requires a fairly large area – enough for a small reservoir—a few hundred meters higher than the generators.
Thermal storage by molten salts (as heat transfer fluids) is now being applied to some large CSP facilities, mentioned above. Experience is lacking. But engineering analysis suggests that it will eventually be very cost-effective.
Storage technology in the form of batteries is obviously critical for the future of electric cars. But without inexpensive energy storage, the capital cost advantages of wind and solar power are wasted assets. With low cost storage, the story is very different: storage batteries, not only for EVs. can be true “game-changers”. While storage battery technology was considered “mature” for most of the last century, a number of new rechargeable battery types like sodium-sulfur or zinc-air (or old ones rediscovered) are now being tested by utilities in the US and elsewhere.
The lithium-ion battery is the brightest star of the current battery constellation. It consists of four main components: anode (negative), separator, cathode (positive) and electrolyte. Battery packs are combinations of cells. The anode, whose job is to absorb lithium ions, is currently graphite/carbon. But lithium titanate is an alternative being developed a Oak Ridge that happens to offer much faster charging capability than graphite, as well as other desirable characteristics. The problem (for now) is a complex manufacturing process. Silicon is another possibility; it is capable of absorbing up to 10 times more lithium ions than graphite. The problem is that the silicon swells when it is fully charged, which causes it to crack and break electrical contacts. Researchers in several institutions (Lawrence Berkeley Labs, Rice University, Stanford and MIT) claim have figured out different ways of solving that problem, such as nano-tubes and nano-wires. The key to success down the road is likely to be manufacturability.
The separator is an inert membrane that is permeable to ions. There are several competing materials. The cathode, which emits the ions, is currently a lithium-cobalt alloy (lithium cobaltite) but a several other materials, such as lithium-nickel-manganese, lithium-iron sulfide, and lithium-iron- phosphate are already in use or being developed. Finally, the electrolyte, currently a liquid or gel, may eventually give way to a solid material that permits up to three times the storage capacity.
Cost savings are potentially possible for each of these components, as well as the manufacturing process. Costs of Li-ion battery packs in 2009 were $1100/kwh. In 2013 they were down to $500/kwh. Tesla claims $300/kwh as of summer 2014. Some industry experts believe that by 2020 they will be down to $200/kwh and possibly to about $100/kwh. The Tesla giga factory now under construction in Nevada will help bring this about {Hummel, 2014 #7731}. But the variety of promising breakthrough technologies, from silicon anodes to solid electrolytes, to titanium cathodes or even lithium air.
Prices for consumer applications have fallen along a classic experience curve from nearly $2000/kwh in 1995 to under $300/kwh by 2005 and the trend continues. Li-ion batteries in larger sizes are already in use for many applications, including aircraft (in the Boeing 287) and in electric automobiles (e,g, Tesla). Prices for these applications have fallen 40% from over $1000/kwh in 2010 to $338/kwh in 2012 and (expected) $300/kwh in 2015. Moreover, prices are expected to decline considerably in the coming decades, from the 2013 range ($400-$500/kwh) to somewhere less than $100/kwh by 2030, if not sooner. See Figures 12 and 13. This price trend will obviously help to bring down the cost (and increase demand, other things being equal) for electric vehicles in the coming decade. That, in turn, will help to reduce demand for motor fuels in the US and Europe.
There are promising battery developments also for another application, namely to enable utilities to cope with variable demand or intermittent supply. In that application physically large batteries made from cheap materials are what the doctor ordered. The most promising technologies in that domain is probably zinc-air or sodium-sulfur. The earliest full-sized examples are very costly, because they are essentially custom-made, but a few such batteries are being tested by utilities, particularly in Japan. American Electric Power Co. began testing a sodium sulfur battery in north Charleston, S.C. in 2007, with an expected life of 15 years. This battery is charged at night and discharged during hours of peak demand. The unit cost $2.5 million, or $2500/kw. which is currently too high for long term competitiveness, but if the cost comes down sufficiently, it could be a significant benefit wbth to utilities and to wind or solar farm developers.


Electric vehicles vs ICEs
The only situation where electrification competes directly with internal combustion (IC) engine power is in automobiles. The first step toward electrification was the battery-electric hybrids (HEVs), starting with Toyota and Honda (c. 2000). Those cars had nickel-metal hydride (NiMH) batteries, but they relied on small IC engines for start-up and cruising, with supplementary battery power used mainly for acceleration and hill-climbing. The batteries are recharged partly by coasting downhill, by deceleration (reducing brake wear) or directly by the engine-generator. The Toyota hybrids offered roughly double the fuel economy of comparable cars, but at slightly higher up-front cost. They began to be competitive in terms of lifetime cost when gasoline costs exceeded $3.25/gal. if battery costs were $260 /kwh, but at $4 per gallon, battery costs as high as $700/kwh were competitive {Hummel, 2014 #7731}.
The next stage was the plug-in hybrid PHEV) such as the Chevrolet Volt, or the Volvo PEV, which are recharged from the grid. The Volt has an all-electric range up to about 50 km but still retains a small supplementary ICE for range extension. It seems to be more efficient for consistent short range use, compared to the Toyota hybrid, mainly because recharge from the grid is more efficient than recharge by the engine. It also has the advantage of being rechargeable directly from a rooftop photovoltaic (PV) system. This means that it can also act as a supplementary energy storage system for the latter. The PHEV’s become competitive at battery prices above $300/kwh and gasoline prices above $3.50/gal. They remain competitive at battery prices above $650/kwh if gasoline prices reach $6.00/gal. {Hummel, 2014 #7731}. Having said this, PHVs still cost 40% to 50% more up front (without incentives) and carry a 200-250 kg weight penalty as compared to comparable ICE models.
Finally, we come to the all-electric car, or EV, exemplified by the Tesla S, the BMW i3, or the Renault Zoe. The Tesla S can be compared to the Audi A-7 in performance. Without incentives, the Audi is slightly cheaper on a monthly cost basis, but with existing incentives, the Tesla S is about $200/mo. (15%) cheaper, taking into account battery costs and fuel costs {Hummel, 2014 #7731}. Note that the economics of EVs are somewhat better for high-end cars, because they are normally more performance oriented and less fuel efficient than cheaper cars. However, as compared to ten or twenty years ago, electric vehicles are approaching, if not already at parity. Roughly speaking , EVs could be competitive with battery costs as low as $150/kwh and gasoline at $2.00/gal. but with battery costs above $400/kwh even at gasoline price of $6.00/gal. {Hummel, 2014 #7731).
The cost driver for EVs is battery cost. It is now clear that the immediate future of batteries, as far as we can see ahead, is the lithium-ion cell. Increasing demand for electric vehicles will, in turn, provide short-term storage capacity for decentralized solar facilities (especially rooftop PV installations) with two synergistic implications. First, it will substantially improve the economics of rooftop PV, compensating to a significant degree, for the intermittency of the source. (There remains a challenge: to organize parking facilities to recharge the EVs during the daylight hours, and to facilitate discharge during the evening, when demand peaks.) Second, it will improve the economics of the EV, because battery recharge by direct current from solar PV is much more efficient than recharge from the grid. And, these two effects, taken together, will dramatically increase the demand for Li-ion battery packs, cutting EV costs and driving up demand for them. That, in turn, will have negative consequences, in terms of grid defection, for the electric utilities with large investments in un-needed central generating capacity {Lovins, 2014 #7682}{Hummel, 2014 #7731}.
We live in interesting times.
[1] This calculation, by Euan Mearns, appeared in his blog “Energy Matters”, Sept 11, 2014
# # #
About the author:
Robert Ayres’s career has focused on the application of physical ideas, especially the laws of thermodynamics, to economics; a long-standing pioneering interest in material flows and transformations (Industrial Ecology or Industrial Metabolism); and most recently to challenging held ideas on the economic theory of growth.